Visual Studio ile Crash Debug (Developer Setup)
İlk iş debugging ortamını doğru açmak.
Debug ayarları:
Debug -> Options and SettingsDebugging -> General- Show disassembly if source is not available → ON
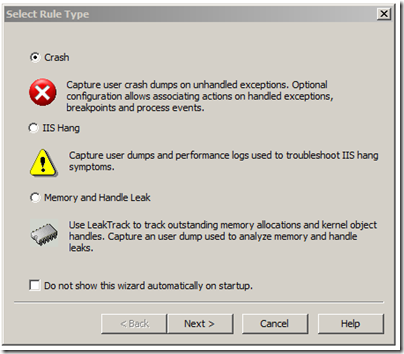
Bu önemli, çünkü source kaybolduğunda en azından assembly görmen gerekiyor.
Project (UserInterface) ayarları
Client tarafında asıl debug burada dönüyor.
UserInterface -> Properties
Linker -> Debugging:
- Generate Debug Info → Yes (/DEBUG)
- Map Exports → Yes (opsiyonel)
- Debuggable Assembly → Yes (/ASSEMBLYDEBUG)
Sonra client + launcher build alıyorsun.
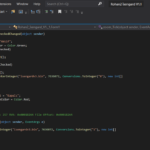
Debug session başlatma (Attach yöntemi)
- Visual Studio →
Debug -> Attach to Process metin2client.exeseç- Attach et
Crash olduğu anda:
- Call Stack direkt düşer
- Hangi function patlamış görürsün
- Eğer symbol düzgünse source’a bile iner
Direkt F5 ile debug (attach)
Daha temiz workflow:
- Solution Properties → UserInterface = Startup Project
UserInterface -> Properties -> Debug- Working Directory → client path
Sonra:
- F5
- veya Debug -> Start Debugging
(Admin ister, launcher manifest yüzünden normal)
Build sonrası otomatik copy (çok kritik QoL)
Her seferinde bin’den client’a kopyalamamak için:
UserInterface -> Properties -> Build Events
Post-build event:
copy /y "$(TargetPath)" "$(LocalDebuggerWorkingDirectory)$(TargetFileName)"
Bundan sonra F5 → direkt client çalışır.
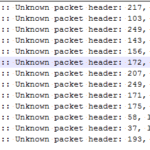
PDB / Symbol problemleri (en çok burası patlar)
Eğer stack garbage geliyorsa:
Linker -> Debug -> Generate Database
- Debug build:
$(IntDir)$(TargetName).pdb
- Release build:
$(TargetDir)$(TargetName).pdb
PDB yoksa debug = körlük.
Yaygın sorunlar
- Visual Studio “Python tools” kuruluysa attach bozulabiliyor
- Microsoft Symbols bazen crash stack’i kirletiyor → kapat
- Modules window’dan PDB load kontrol et
Paylaş :